Blogs
The Coffee Cup : Profit Monitoring Dashboard
From Data to Dashboard - A Visualization Pathway
Audience Analysis
The senior management team is responsible for strategic decision-making and overseeing company operations. They need clear, concise, and accurate data analysis, with a focus on actionable insights that drive business growth and efficiency. Their preferred format includes visual representations of data through executive dashboards highlighting critical KPIs. While they have a high understanding of business concepts, they prioritize summarized findings with clear recommendations over technical details. Communication should be professional, concise, and avoid technical jargon. They value the accuracy, relevance, and timeliness of data to ensure it informs strategic decisions and monitors performance effectively.
Data Analysis
For this project, I analyzed the Coffee Cup dataset focusing on Beverages and Inventory. The dataset contains 4248 records with 17 attributes, including 8 categorical and 9 numerical attributes. There are no null or duplicate records. During the Exploratory Data Analysis, I identified two negative records from 2012, which were omitted to maintain data integrity.
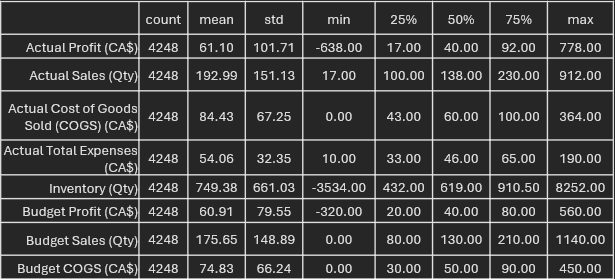
• Descriptive Statistics
For this project, I analyzed the Coffee Cup dataset focusing on Beverages and Inventory. The dataset contains 4248 records with 17 attributes, including 8 categorical and 9 numerical attributes. There are no null or duplicate records. During the Exploratory Data Analysis, I identified two negative records from 2012, which were omitted to maintain data integrity.
• Data Quality
I identified several outliers in the numerical attributes, which could suggest data quality issues. Potential weaknesses and false indicators due to data quality were noted, with room for attribute adjustment to improve the analysis.
• Data Insights
The dataset provides valuable insights into the performance of the Coffee Cup business, particularly in the areas of beverages and inventory management. By addressing the data quality issues, we can derive more accurate and actionable insights to drive business decisions.
Key Performance Questions
- 1. Revenue Trends: What is the total current year revenue, and how does it compare to last year?
- 2. Profit Trends: What is the total current year profit, and what is the percentage change from last year?
- 3. Product Performance: Which product type generated the highest and lowest profit this year, and how does it compare to last year?
- 4. Market Contribution: What percentage of revenue comes from each market size?
- 5. Top Products: What are the top five products by profit, and how much profit did each generate?
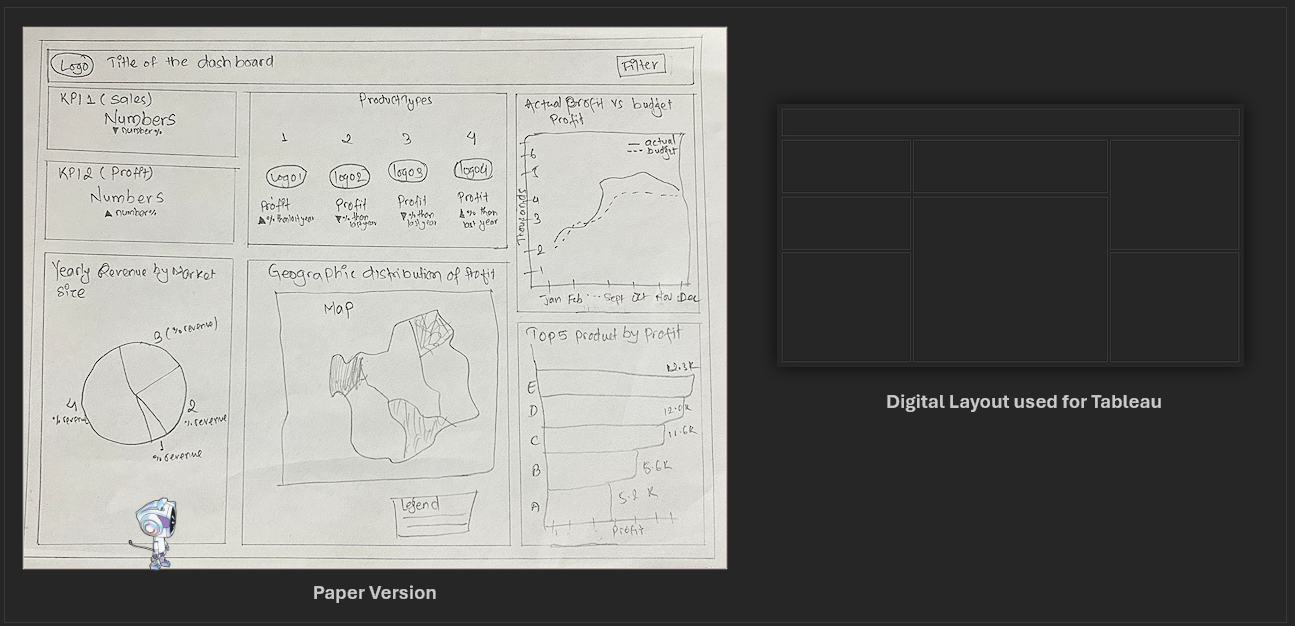
Mock Up Sketch for Dashboard
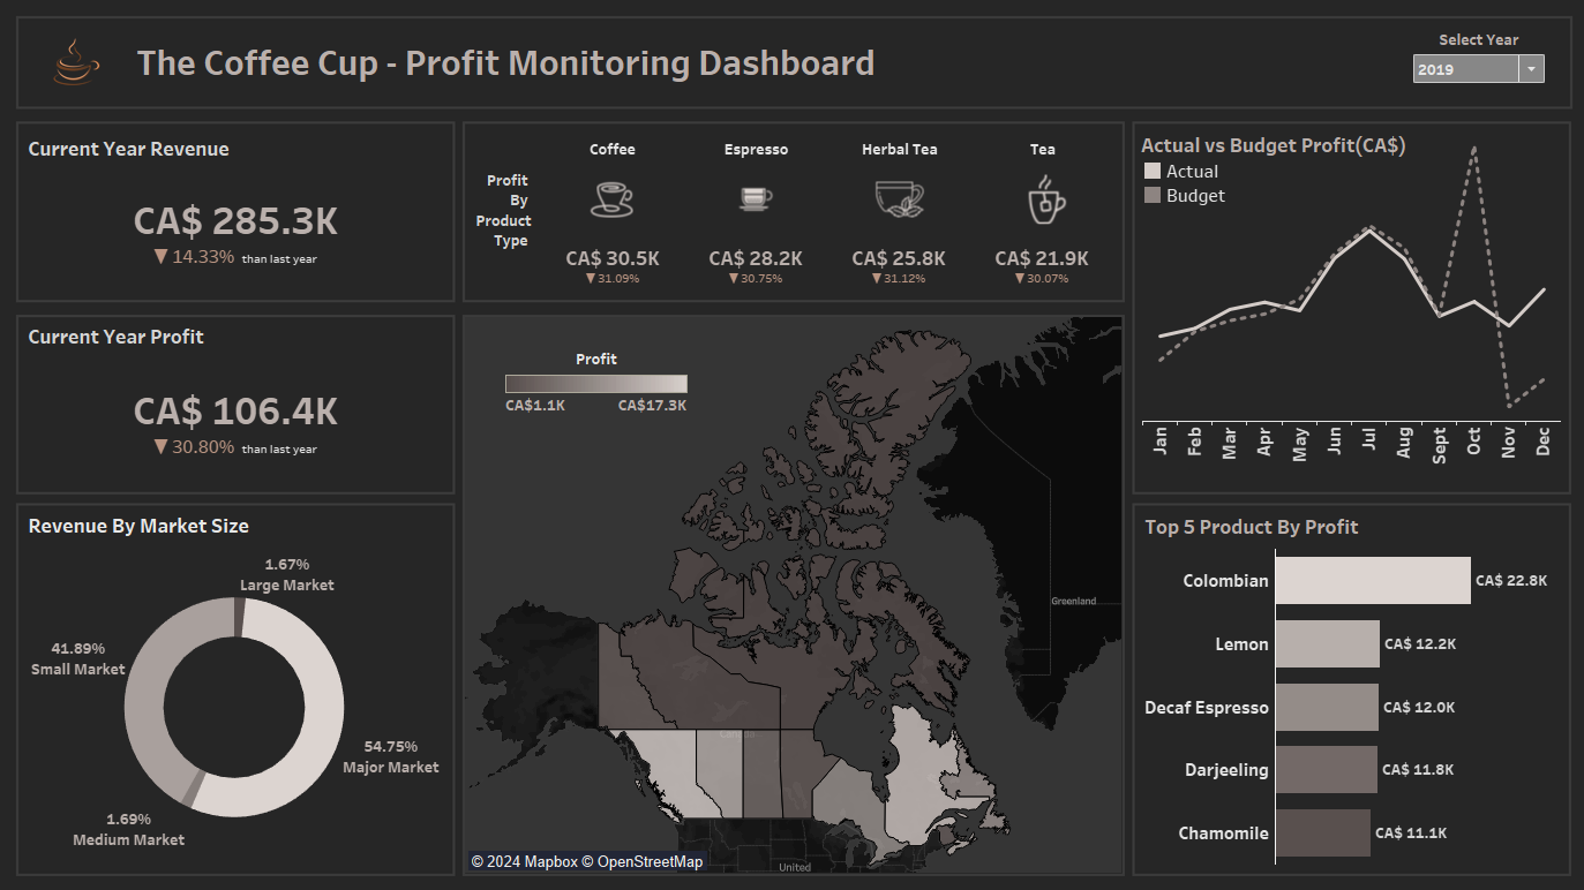
Final Dashboard
This comprehensive dashboard offers an insightful overview of The Coffee Cup's financial performance in 2019, emphasizing critical performance metrics such as revenue, profit, and market size distribution. It is designed to provide a clear and concise representation of the business's financial health.